Ignacio Sepúlveda
SDSU Coastal Engineering
Uncertainty: Relevant projects on probabilistic hazard assessments and uncertainty quantification
Tsunami hazard assessments commonly rely on the simulation of reasonable synthetic earthquake scenarios to be happened in the future. While we cannot predict some characteristics of a future event, we can exploit some statistical properties empirically, determined from past earthquakes. These statistics are employed to model uncertain earthquake characteristics as random elements. I have devoted my career on developing new mathematical tools to quantify the uncertainty of earthquake sources characteristics (slip distribution and location) and other inputs playing a key role in tsunami hazard assessments.
Tsunami hazard assessments with consideration of uncertain earthquake slip and location
With Drs. Philip Liu, Mircea Grigoriu and Matthew Pritchard, we reviewed the methodologies to model the quantification and propagation of uncertainty by mean of stochastic approaches. We apply these approaches to the characterization of uncertain slip and location of future earthquakes and propagate the uncertainty to tsunami responses at the coast. Paper published in JGR Solid Earth.
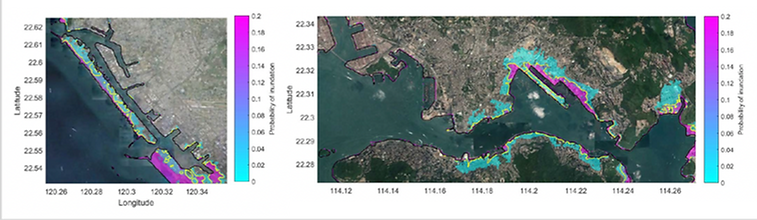
Probability of inundation in Hong Kong (China) and Kao Hsiung (Taiwan) due to Mw 9.0 earthquakes in the northern section of the Manila Subduction Zone. The earthquakes have an uncertain slip and location. These results are obtained using the paper's methodology.
Probabilistic Tsunami hazard assessment in South China Sea with consideration of uncertain earthquake characteristics
This study extended the one of above and included the uncertainty of the earthquake occurrences with an approach known as probabilistic tsunami hazard assessment (PTHA). We used a splitting Poisson process approach to combine all the uncertainties in a single probabilistic measure. We also analyze further uncertainties, associated with the probability properties of the uncertain earthquakes. This paper applies the methodology in South China Sea by considering earthquakes generated in the Manila Subduction Zone. Paper published in JGR Solid Earth
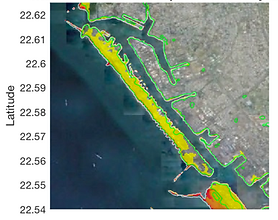
Return period of inundation in Hong Kong (China) and Kao Hsiung (Taiwan) due to earthquakes in the Manila Subduction Zone. We present the results in a logarithmic color scale. These results consider the uncertainty of earthquake recurrence. The methodology is explained in the paper.

Non-stationary Probabilistic Tsunami Hazard Assessment Incorporating Climate-change-driven Sea Level Rise
I developed a new formulation to combine probabilistic tsunami hazard assessments (PTHA) with the climate-change-driven sea level rise (SLR). The new formulation is based on a non-stationary Poisson Process model. Paper published in AGU Earth's Future.
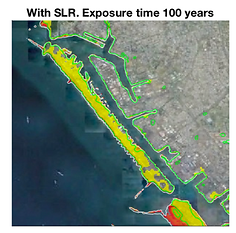
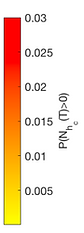
Probability of inundation in Hong Kong (China) and Kao Hsiung (Taiwan) due to earthquakes in the Manila Subduction Zone during a exposure time of 100 years. These results consider the uncertainty of earthquake characteristics and recurrence. The methodology is explained in the paper.

Tsunami hazard assessment with consideration of uncertain bathymetry
This study aims to assess the impact of bathymetry uncertainties on geophysical ocean models (e.g. tsunamis). It can be divided in two main topics: the characterization of uncertainties and the propagation of uncertainties. First, we aim to assess the characteristics of the errors of the bathymetry data. These errors depend on the technology used to acquire data and additional post-process techniques (e.g. interpolation). One of the bathymetry data type we plan to analyze is the satellite-altimetry-derived data. The second topic is the propagation of uncertainty from bathymetry to tsunami response simulations. In my PhD thesis we proposed a methodology in which bathymetry errors are modeled as a random field. Paper published in JGR Solid Earth.


Above/Left: Comparison between a multibeam survey and the altimetry-predicted bathymetry in northern Chile. Above/Right: (a) Power spectral density of the multibeam survey (left panel). (b) Black bars represent the histograms of the high wavenumber content of the multibeam bathymetry. Green and red lines represent the best fit Laplacian and Gaussian distributions, respectively, with zero mean and equivalent variance. (c) Blue dots represent the power spectral density of the multibeam data collapsed in terms of wavenumber (same information as panel (a)). Red dots represent the power spectral density of the altimetry-predicted bathymetry. The black vertical lines indicate the filter separating long and short wavelengths. (d) Power spectral densities the altimetry-predicted bathymetry error. The lower left corner shows the modeled power spectral density for a Von Karman function with a = 4 km, H = 0.975, and 𝜎e = 160 m. (e) Histograms of the altimetry-predicted bathymetry error(black bars), modeled Laplacian distribution (green line), and modeled Gaussian distribution (red line) using the same sample variance. (f) Variance-normalized power spectral density of bathymetry error as a function of k. The dashed red curves correspond to the best fit Von-Karman curve. Values of the best fit values of H, a, and rms error on a logarithmic scale are reported in the insets.

Left: Average of tsunami responses (above) and uncertainty standard deviation (below) in 3 nested-grid regions. Below: Time histories of the tsunami elevation for many bathymetry samples (i.e. the several black curves are related with different bathymetries). The yellow and red curves show the 50% and 95% exceedance curves. Note that uncertainties are larger in coastal regions and for trailing waves. This is expectable as trailing waves commonly have shorter wavelengths. Consequently, they are more impacted by the bathymetry uncertainties, which have short wavelengths.

Propagation of Uncertainty by Means of Polynomial Chaos Expansion
The Polynomial Chaos Expansion (PCE) is a spectral method used to propagate uncertainty. In the same way as a spectral method (to model a problem in the physical space), the PCE aims to model a stochastic problem by a representation of spectral modes in the random space. This is useful because we can reduce the parameter space of the problem by only solving for a few modes. This reduction of the parameter space (i.e. random dimensions) can reduce
computational times greatly. The PCE has the potential to significantly reduce the computational time of a problem but it is associated with significant challenges when intrusive methods are used. First, additional stability problems can be triggered when combined with numerical schemes., Second, the computational cost can significantly increase when the problems contains many random dimensions. Third, the spectral methods functions in a L-2 space. This means it will be difficult to represent the tails of distributions. Besides the challenges, we believe some specific problems can take full advantage of the PCE and reduce the computational times of our problems.
The video shows the tsunami uncertainty caused by an uncertain propagation depth (representing the uncertain tide when a tsunami is triggered). Note that the PCE solution provides the temporal evolution of the uncertainty (represented by the coefficient of variation equal to the standard deviation divided by the average surface elevation). The uncertainty is zero at the initial time and it grows once the tsunami interacts with the uncertain depth.
Free Source Model "GARFIELD: Geophysical Applications of Random FIELDs"
I am developing a new code which aim generate samples of complex random field models. The code is aimed to be used by scientists with some knowledge in stochastic analysis. We will be able to include heterogeneities, conditional information and varying anisotropies. The new methods will help to improve the generation of earthquake and bathymetry models. We are also looking for new applications.


Above: Samples from GARFIELD tests considering a changing in correlation (left, smaller correlation lengths at the bottom), conditional information (middle, zero in diagonals) and correlation length and anisotropy changes plus conditional information (right). Below: An application case for an earthquake slip distribution in a subduction zone with anisotropy changing along strike and conditional to zero slip in some borders (left) and the christmas star (right) developed in December 2019 for my son. Correlations lengths and anisotropies change at the five tips of the star.